
Is there a forecast tool that can help franchisees pick brands with higher growth potential? Whether you’re a buy-and-hold investor or looking for a quicker return building a new unit and selling it, the ability of a brand to expand over time obviously influences your investment decision but how do you evaluate that ability? Is there a way to determine which brands have the best opportunity to grow their brands and which might struggle? The sales-to-initial-investment ratio (S-II ratio) might hold the key to forecasting future growth. (For those of you who like to get a little statistically geeky, read on.; for those who don’t just jump to the concluding section at the bottom).
The S-II ratio is a simple equation that combines both risk and reward of starting a unit into an easy to understand number. As part of a recent client analysis, one of our senior analysts, David Swift, examined the relationship between the S-II ratio and new unit development (as a percent of existing units) to serve as a proxy for brand growth. Any investor would expect that unit sales and expense will impact the likelihood a potential franchisee would want to buy a unit, but we found that relationship is more complex than it appears.
That Stats on the S-II Ratio
We looked at 70 QSR and sit-down restaurant concepts for this analysis[1]. While there was always a positive relationship between S-II ratio and new unit development, the slope of that line and the accuracy of that relationship were very much dependent on the size of the initial investment.
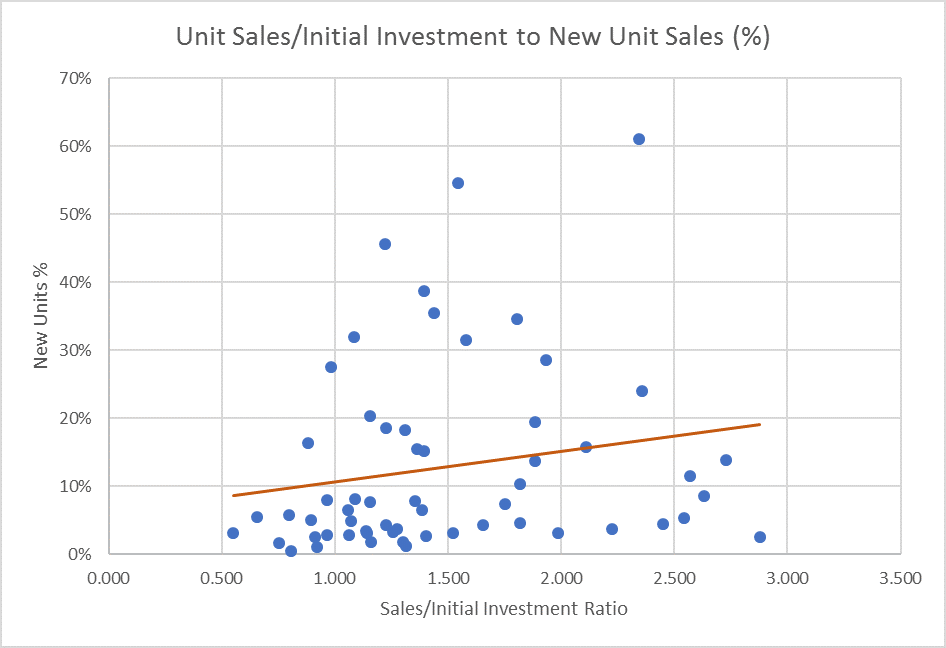
The statistical baseline showed a positive slope of 0.044 with an R2 of 0.18 and p-value of 0.16. What that means is that while there is positive relationship it does not explain much of the ability to sell a new unit and we can’t be confident in its predictive value. To understand the power of this ratio we need to find something more to explain the relationship if economic common sense is to prevail.
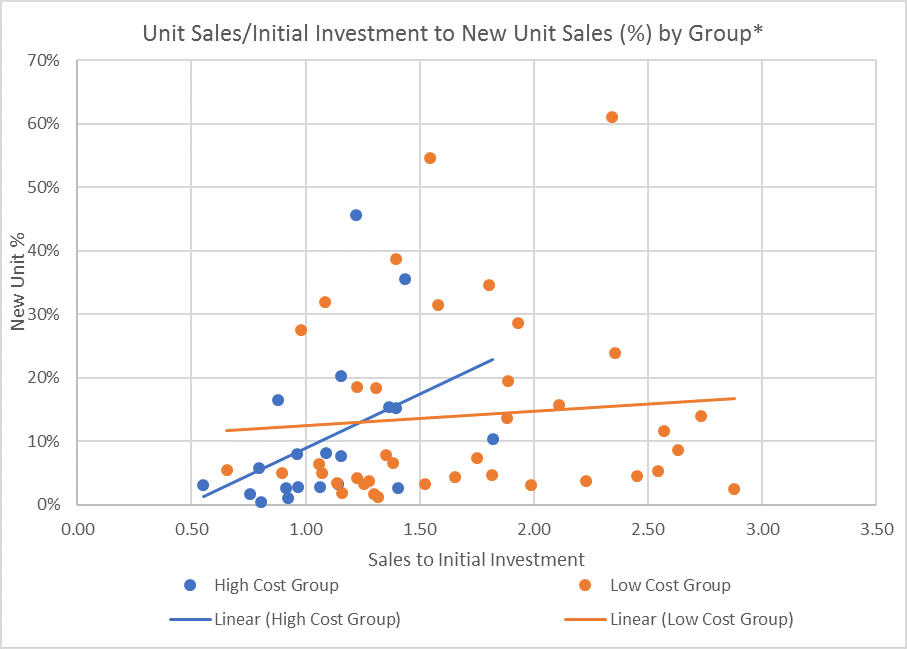
Perhaps rationality is affected by the investment level, the theory being that the higher the initial investment, the likelihood that economic rationality will reveal itself while lower investment levels might be more prone to emotional decisions. We split the brands into two sets around average initial investment, those that have higher average initial investments and those that have lower average initial investments[2].
For the high investment group, the slope increased 0.16, while the R2 increased to 0.41 and the p-value decreased to 0.06, all of which means we now can associate standard economic investment logic for nearly half of the new unit investment decisions and are more than 90% confident the logic is valid.
Finally, we looked at a smaller subset of the high investment group, looking only for comparable brands that might compete for potential franchisees. These 20 sit-down brands have average initial investments of approximately $1.5 million[3] with a low estimate of $150 thousand.
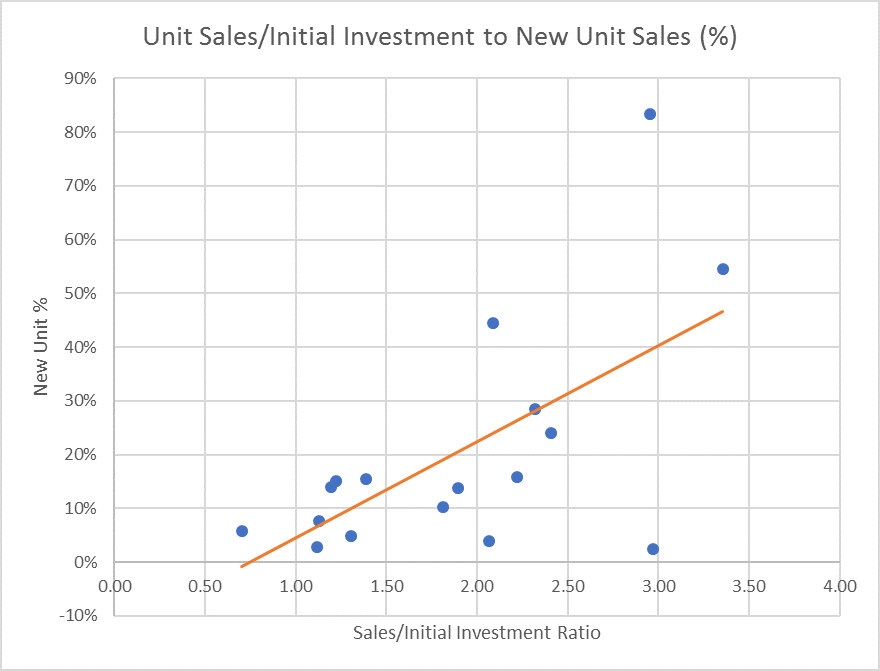
The resulting regression gives us a slope of 0.17, an R2 of 0.62, and a p-value of 0.007. While the slope hasn’t changed much the value of the S-II ratio now informs more than 50% of the decision to buy and we can be more than 99% confident in the relationship.
What Does This All Mean
All this math, simply put, means that the higher the S-II ratio the more units these brands were able to add and brands with an improving S-II ratio are poised to increased new unit sales the most.
As an example, imagine two brands, both with 100 units and the same initial investment of approximately $1.5 million. Brand X has a S-II ratio of 1 while Brand Y has a S-II ratio of 1.3. Based on actual performance of 70 brands in this analysis, the S-II ratio equates to Brand Y adding 5 more units in the next year than Brand X. Over time this advantage would increase at an increasing rate as the gap in units increased.
There you have it. Unit performance matters and can be measured in actual system growth differences. “How much can I make” really does matter and the differential impact isn’t just related to how good a franchisor’s CDO is at selling.
[1] Brands had to have at least 10 existing units to be included
[2] Approximately $1.4 million was the dividing line
[3] Any purchase of land and buildings was removed to make initial investments across brands more comparable.
Another version of this originally appeared in Multi-Unit Franchisee Magazine Issue 3, of 2018. See it in print on page 86!