
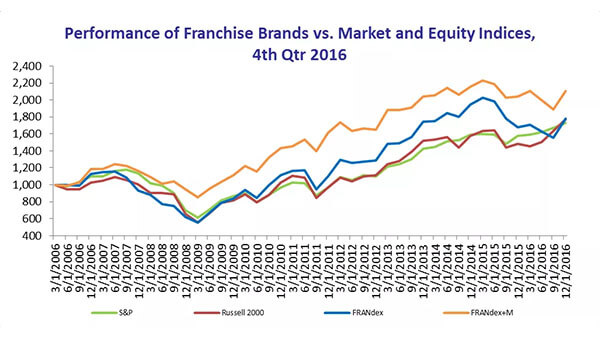
FRANdex tracks the performance, based on market capitalization, of 60 U.S.-based publicly-traded companies operating under and generating income through the franchise business model. Collectively, these companies operate 138 franchise brands. All index levels are normalized to 1,000 at Q1 2006 for comparison purposes, and all remaining periods are adjusted accordingly. As McDonald’s represents over 25% of the overall market capitalization of publicly-traded franchise companies, it is excluded from the base FRANdex, but shown as FRANdex+M.
FRANdex outperformed both the S&P 500 and Russell 2000 with a return of 14.69% in Q4 2016. This gain was driven especially by the non-food segment, which saw a strong return of 22.32%. Food brands ended the quarter with a 4.89% gain. In Q4, small caps again outperformed large caps. The S&P 500 and Russell 2000 ended with fourth quarter returns of 3.25% and 8.43%, respectively.
Over the full year, FRANdex grew by 6.4%, trailing both the S&P 500 and Russell 2000, which registered gains of 9.54% and 19.48%, respectively. Non-food brands gained 9.59% for the year, while food brands posted a modest rise of 1.96%. The lodging industry responded particularly positively to the overall economy. Marriott (MAR) and Hilton (HLT) were among the biggest gainers, after adjusting for component weights. YUM! Brands (YUM) took the largest loss for this quarter and this year.
An investment in the FRANdex basket of stocks would have yielded quarter-over-quarter returns in the last 11 years that exceeded both the S&P 500 by an average of +0.79% and the Russell 2000 by an average of +0.63%.